


Console Screen
A console is a diagnostic tool that shows hidden messages from your web page — errors, warnings, and system logs — and lets you see exactly what your code is doing behind the scenes. In a normal browser like Chrome or Safari, it's the developer tool you open to debug a site.

Console application
A text-based interface used to run and interact with a program directly through typed commands and printed output.

Diagnostic console
A built-in tool inside a software environment — like a web browser — used to view logs, print text, and debug code as it runs.
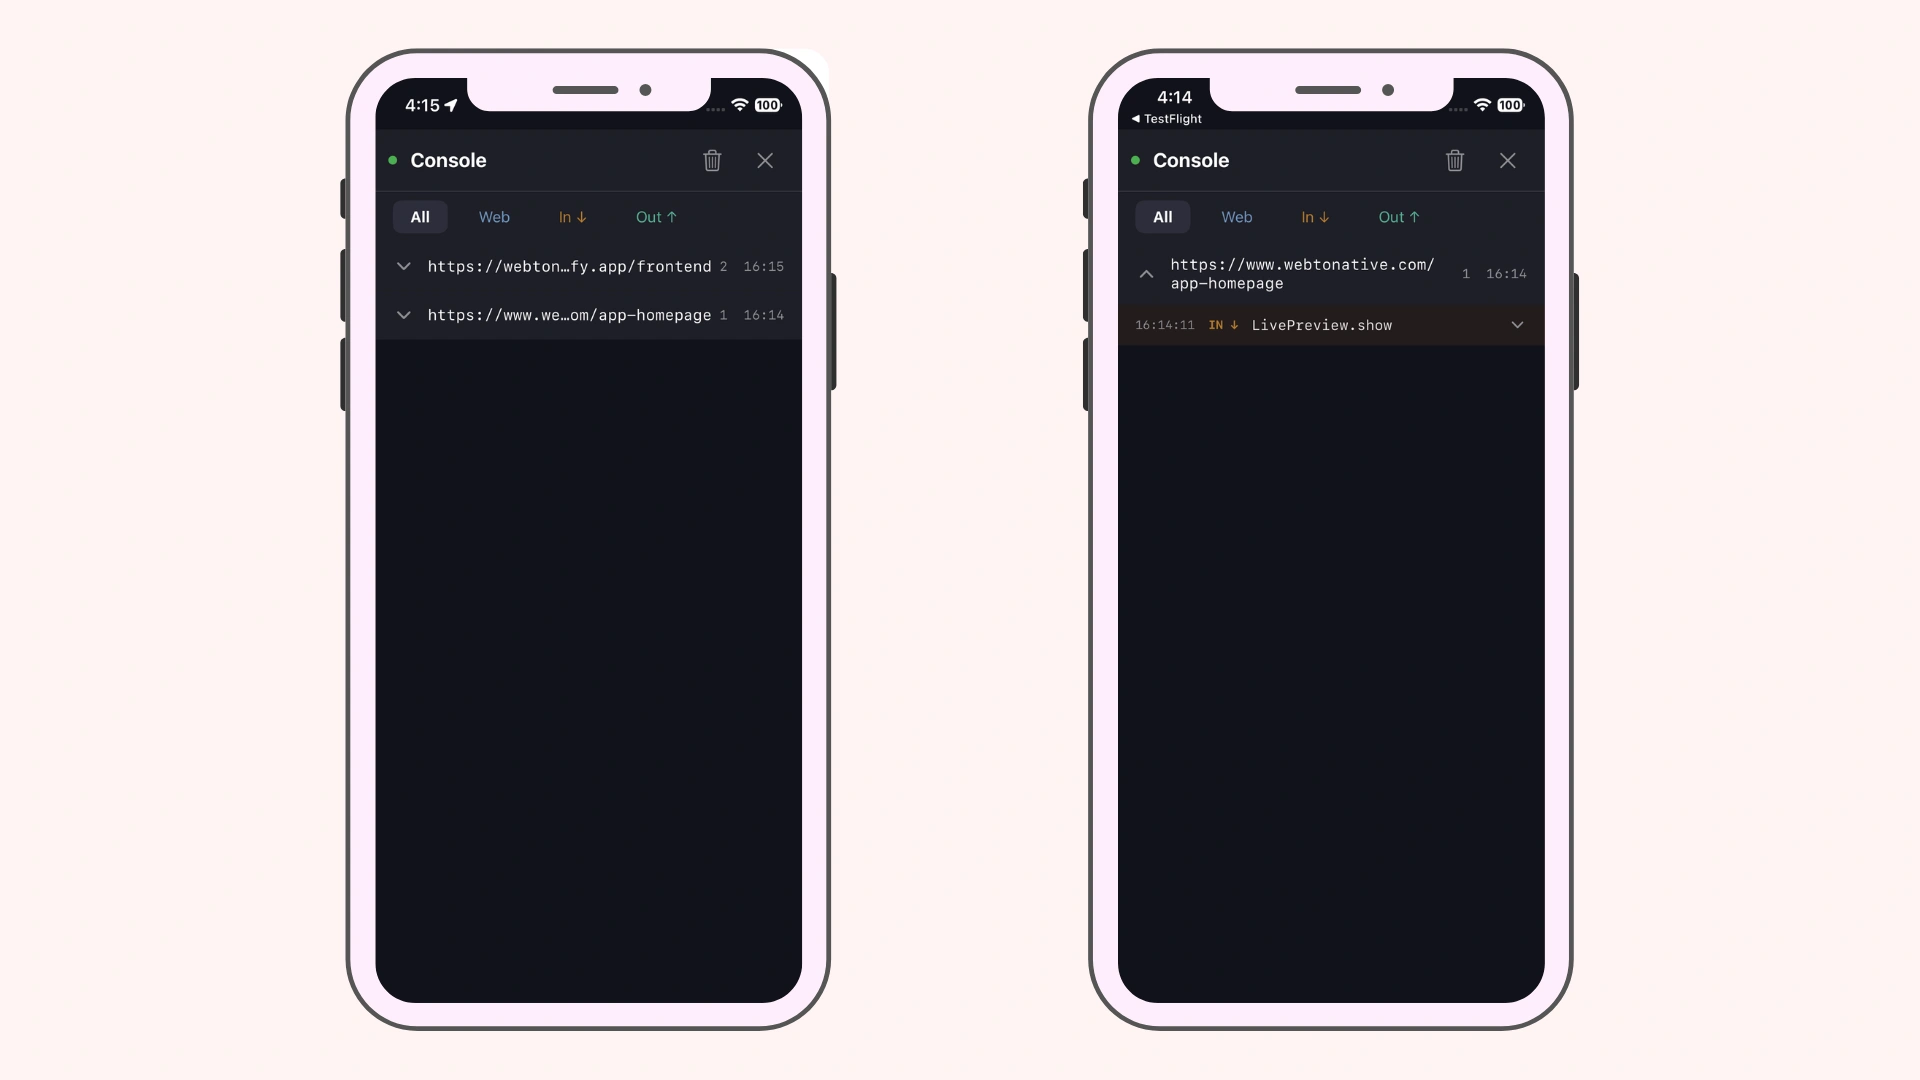
The problem: inside a native app, there's no browser address bar to open DevTools from. Console Screen solves that — it brings a console viewer inside your WebToNative app, so you can see logs on a real device without wiring up remote debugging.
This feature is available for both Android and iOS apps, from the Starter plan and above.
How to open it
You open the console by navigating to a special URL. The app intercepts it and slides the console viewer in as an overlay — your page never actually leaves.
w2n://console-screen
The URL that opens the debugger
| Option 1 | Option 2 |
|---|---|
| Plain HTML link | From JavaScript |
| Wire it directly to a link or button: | Trigger it from code by setting the location: |
<a href="w2n://console-screen">Open Debugger</a> | window.location.href = "w2n://console-screen"; |
Since anyone who can navigate to this URL can open the console, most apps hide the trigger — a button on a support page, a secret tap sequence, or behind a flag you control from your own backend — so regular users don't stumble into it.
What the console shows
Console output
Every 'console.log', 'info', 'warn', and 'error' call — plus uncaught errors and unhandled promise rejections — grouped by the page URL they came from.
Native bridge traffic
Calls made through 'window.WTN.*' and their responses, so you can see exactly what your site sent to the app and what came back — right alongside your console logs.
Search, filter & clear
A search bar to filter entries by URL, filter tabs to narrow by type or direction, and a clear-all action to wipe the current list.
Types of log

Web
Errors, logs, warnings, and other messages generated by the website's own JavaScript console — the standard 'console.log', 'warn', and 'error' output.

In
Events triggered from the website to the native app through 'window.WTN.*', including the parameters the app received. This is what your site sent.

Out
The response returned by the app after processing an event — whether the operation succeeded or failed, along with any returned data or error details. This is what the app sent back.
Reading In and Out together lets you trace a full round trip: what your site sent to a native feature, and exactly what came back — the fastest way to diagnose a bridge or native-feature issue.
How it works
w2n://console-screen is a custom URL scheme, not a real page URL. Both the Android and iOS apps intercept navigation to it at the WebView level and cancel the actual navigation — so your page never unloads. The console viewer just slides in on top of whatever screen is currently showing.
Because nothing needs to load on your page for the interception to happen, this works on any page — even one where the WebToNative JavaScript file hasn't been imported. Close it with the ✕ in the top bar or the device back gesture, and you're returned to the page exactly as it was underneath.
Unlike most WebToNative features, this doesn't go through the window.WTN bridge — there's no script to import and no npm package. It works purely by navigating to the special URL.
Full reference — opening patterns, what's captured, and behaviour details — in the developer docs. https://docs.webtonative.com/javascript-apis/debugger (opens in a new tab)
Frequently Asked Questions
My console is not working — what should I check?
The most likely cause is an older app build. If you enabled this feature after your current app was built, the interception logic isn't in that build yet. Take a new build and install it — the console will work once you're running the updated version. Also confirm you're on the Starter plan or above, and that you're opening the URL from inside the app rather than a normal browser.
Do I need to import the WebToNative JavaScript file to use this?
No — this feature doesn't use the window.WTN bridge at all, so it works even on a page where that script hasn't loaded. The app intercepts the special URL at the WebView level, so nothing needs to be present on your page for it to open.
What happens if I open the URL in a normal browser, outside the app?
Nothing useful — browsers don't recognise the w2n:// scheme, so the navigation just fails silently. Only rely on this from links or buttons that are reached from inside your WebToNative app.
Does opening it change my page's URL or reload the page?
No — the app cancels the navigation before it actually happens, so your page never unloads and the URL doesn't change. The console opens as an overlay on top of the current page, and closing it returns you to exactly where you were. It also won't trigger a beforeunload event.
Can I close the debugger from JavaScript once it's open?
No — there's no programmatic call to dismiss it. The user closes it with the on-screen ✕ or the device back gesture/button.